If you’ve been running a restoration company over the past few years, you’ve probably asked yourself more than once: “Did I forget how to run a business – or did the business change on me?” The truth is that the business has changed.
The restoration world that many of us grew up in – steady claim flow, predictable pricing, fair margins – looks nothing like the one we’re working in now. We’re facing a perfect storm:
- Fewer claims hitting the street, especially the non-catastrophe (non-CAT) jobs that used to fill the calendar.
- Bigger jobs when they do come, with heavier documentation and more scrutiny on every invoice.
- Higher input costs across the board – labor, equipment, insurance, and compliance.
- Slower payments that can stretch weeks or months.
- Lower trust, with more players and more friction in the claims process.
Contractors feel it in payroll. Carriers feel it in loss ratios and litigation. Policyholders feel it in premiums and deductibles. We’re all in the same storm – just in different boats.
This isn’t a blame game. But here’s a reality check from the field: the math isn’t adding up for anyone. It’s time to look at what’s really driving the strain and how we can get back to a system that works for everyone – restorers, insurers, and the people we serve.
The Slow Drift of Restoration Pipelines
Over the past five years, the day-to-day restoration pipeline has shrunk. Non-CAT claims – formerly the bread and butter for most contractors – have dropped to multi-year lows. There aren’t as many “everyday” losses.
When the weather stays quiet, it’s great news for carriers, but it can be a gut punch for restorers. We’ve had several quarters lately when storms were milder, especially in 2025. At the same time, deductibles have climbed. Commercial policies are now at $25,000 or more, and homeowners are choosing not to file smaller claims because they’re afraid of premium hikes or non-renewals.
When jobs do come, they’re bigger, slower, and more expensive to carry. Costs for wages, fuel, materials, and insurance keep rising while payments drag out for months. Carriers are under pressure to manage loss ratios, and contractors are documenting every inch to protect themselves. Homeowners are frustrated and anxious.
The result? A system that used to move fast and fairly is now bogged down by caution and paperwork. It’s been a slow drift, rather than a sudden crash.
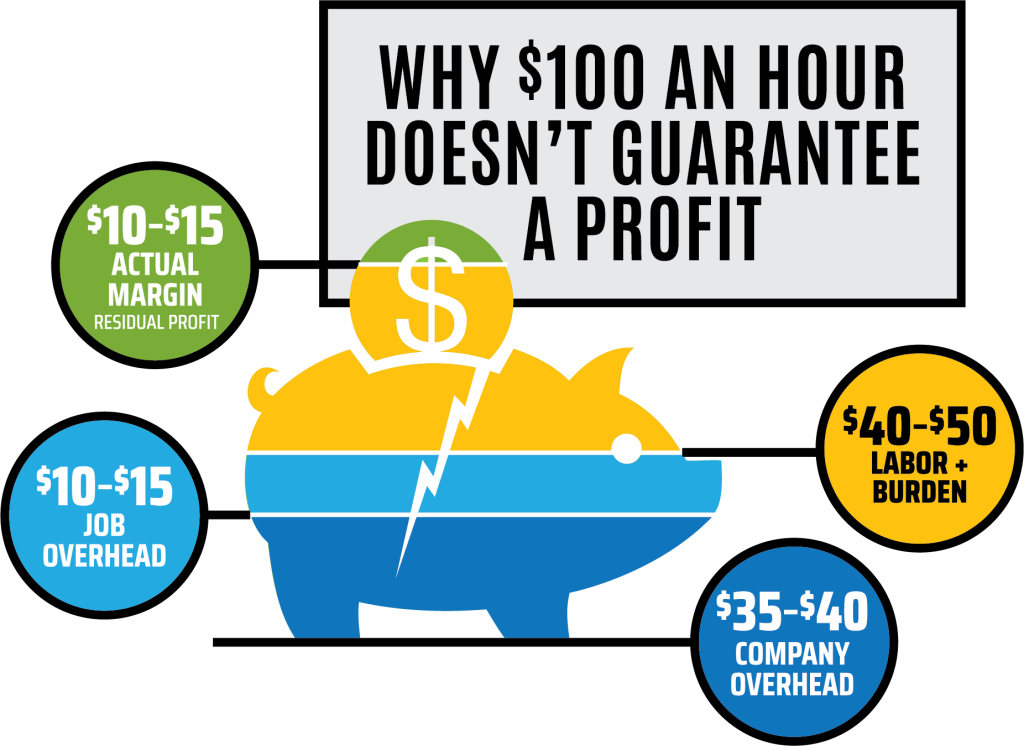 Why $100 an Hour Doesn’t Guarantee a Profit
For years, most of us have lived with the idea that $100 an hour for skilled restoration work was solid. On paper, it looks healthy: you pay your team, cover the truck, and there’s something left over. But many contractors are now working harder for less.
The RIA’s 2024 Cost of Doing Business Report tells the story:
- Average overhead is 38% of gross revenue.
- Average net profit before taxes is 3.8%.
- More than one-third of companies are breaking even or losing money.
Out of every $100 billed, about half covers wages and benefits, another third covers overhead, and the rest – maybe $10–$15 – is actual profit. In high-cost markets or when payments drag out, that margin can drop to zero.
We call this the profit illusion. Rates haven’t changed much in a decade, but nearly every other cost has. Payroll, benefits, compliance, insurance, vehicles, and software all cost more today. Even “10 and 10” – the long-standing overhead and profit markup – sometimes works, but no longer always covers the cost of doing business.
Again, this isn’t about blame. The industry has outgrown its old math.
 The Hidden Costs of Delays
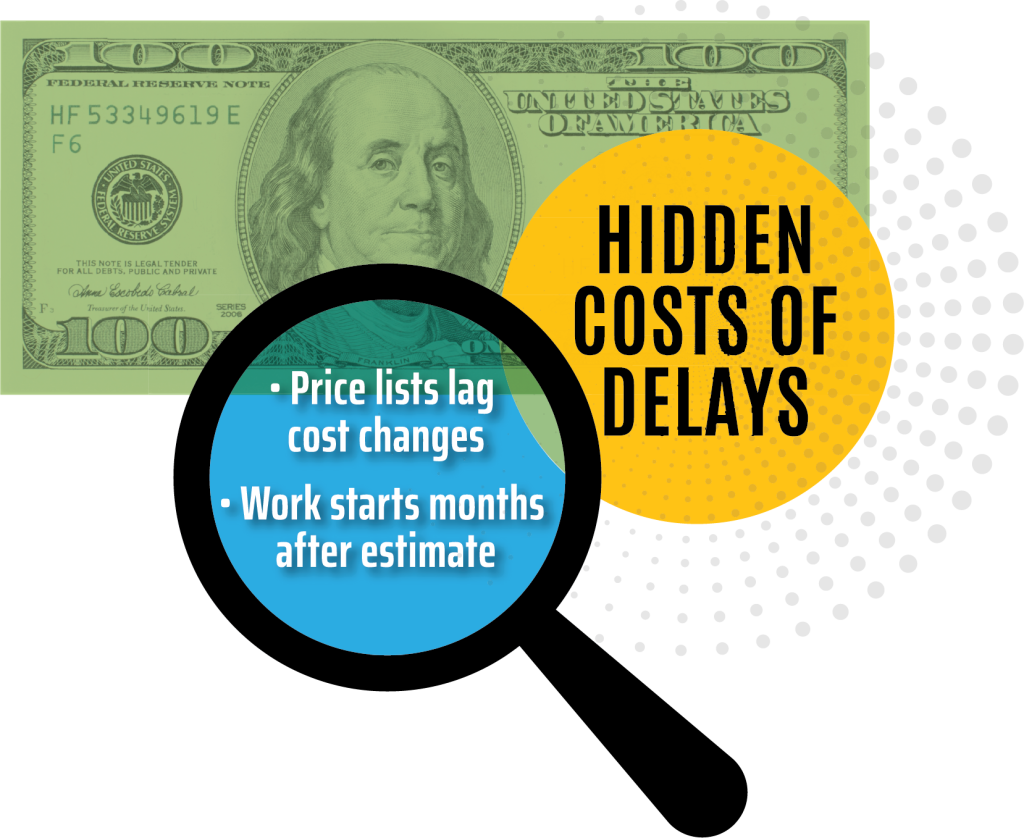
Even when pricing looks fair on paper, one factor quietly erodes profit on nearly every job: time.
It’s a familiar pattern. The estimate is written, the scope is approved, permits are pulled – then weeks or months pass before work begins. By the time the project is finished and payment arrives, labor and materials costs have already risen.
The Verisk 360Value Reconstruction Cost Analysis for late 2025 shows reconstruction costs up 3.8%, with labor rising about 4% and materials 2%. In wildfire and hurricane regions, increases were roughly twice as high. On a $250,000 rebuild delayed four months, that shift can wipe out $7,500-12,000 in margin; on a $1 million job, more than $30,000 before it begins.
This isn’t mismanagement – it’s a built-in lag between estimating, executing, and getting paid. Carriers rely on price lists that quickly become outdated, while contractors pay for labor and materials in real time. The longer the delay, the smaller the profit.
A few straightforward fixes can help:
- Use current pricing. If work starts months after the estimate is written, update it to reflect today’s costs.
- Update change orders. When the scope or timing changes, apply the current month’s pricing rather than the original pricing.
- Link payments to milestones. Tie draws to clear progress points and documentation to keep payments on schedule.
None of this requires new systems – just agreeing on timing and consistency. Contractors shouldn’t have to absorb the cost of inflation, and carriers benefit when qualified firms remain stable.
 Pressure Points in Property Claims
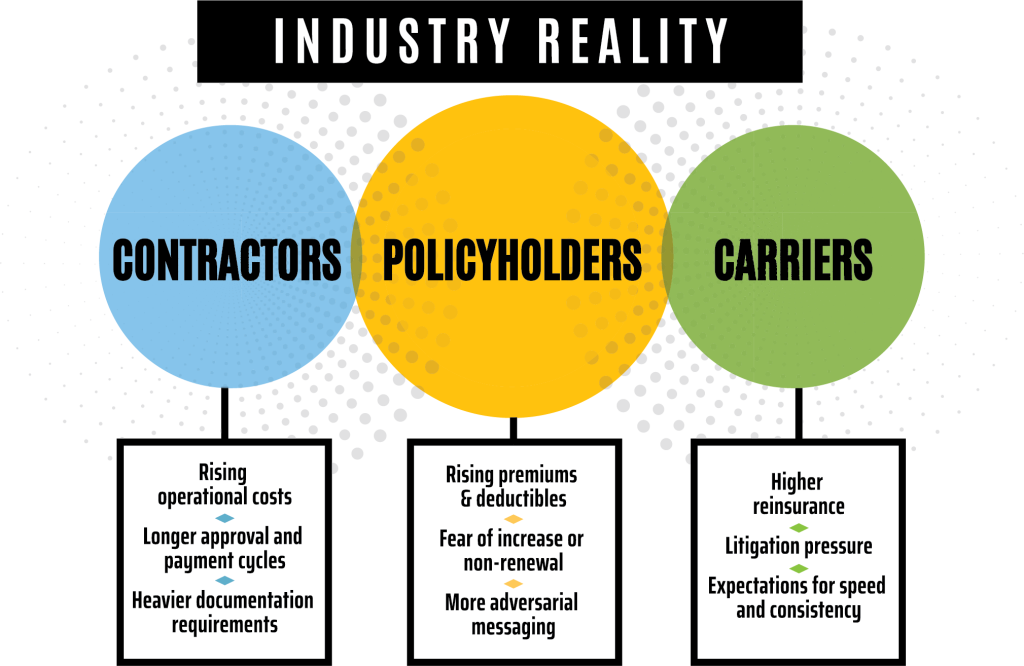
Today’s property claims system is under pressure from three directions: contractors, carriers, and policyholders. Each faces real challenges, and each is reacting rationally to manage risk. The problem isn’t one group – it lies in how those pressures overlap and slow the process for all.
Restorers are carrying more weight than ever – compliance, documentation, equipment, safety, and training – while navigating longer approvals and rising costs. Every delay ties up cash and adds non-billable administrative time. The RIA report confirms that overhead is increasing, payment cycles are lengthening, and even profitable firms are facing cash flow strain.
Carriers are under financial pressure, too. Reinsurance costs (due to volatility in mega-CAT years) are up, litigation is more frequent, and regulators expect faster, more thoroughly documented claims. Many carriers are using automation and remote assessments to improve consistency, but these tools can miss nuances in scope.
Policyholders are paying higher premiums and deductibles, and non-renewals are becoming more common. Many policyholders skip filing smaller claims or try to manage repairs themselves. At the same time, the public conversation around insurance has grown more adversarial, with attorney ads and online forums often framing claims as disputes rather than partnerships.
Finding Common Ground: Each group is acting rationally based on its own pressures, but together those pressures create friction, longer timelines, and thinner margins. Restorers need reliable cash flow. Carriers need accurate documentation. Policyholders need trust and transparency. Aligning these goals is the way to move forward. When trust improves, so does speed, and everyone benefits.
How Smart Operations Protect Profit
Despite all the pressure on costs, margins haven’t disappeared entirely. They’ve just shifted.
For restoration companies that own and maintain their own drying and monitoring equipment, those assets can still produce solid returns when they’re managed carefully. Properly deployed equipment lines remain among the most stable contributors to profitability, as long as teams stay disciplined in tracking and justifying their use.
On the other hand, pure labor work, such as detailed cleaning, contents, and light demo, is where many contractors see the thinnest margins. Labor is fully burdened, supervision and travel are often under-reimbursed, and administrative time is rarely billable.
For labor-heavy shops, it’s critical to:
- Track indirect time accurately – Include costs for mobilization, travel, daily setup, and cleanup.
- Prequalify expectations – Agree in writing on how work will be measured and approved before it begins.
- Use production standards – Measure output against conditions and materials, with photo and/or video evidence.
- Document strategies – Communicate clearly why a restoration method was chosen (e.g., selective demo versus full reconstruction).
 What Overhead Really Costs
There’s a lot of conversation in the industry about what “normal” overhead should be. The truth is, there isn’t one. The RIA average is 38% of gross revenue, but every firm’s structure, market, and service mix make it unique. Many variables, including local wage and insurance rates, fleet size, rent costs, and training and compliance programs, shape overhead. The goal isn’t to match the benchmark, but to know your own number and make decisions based on it.
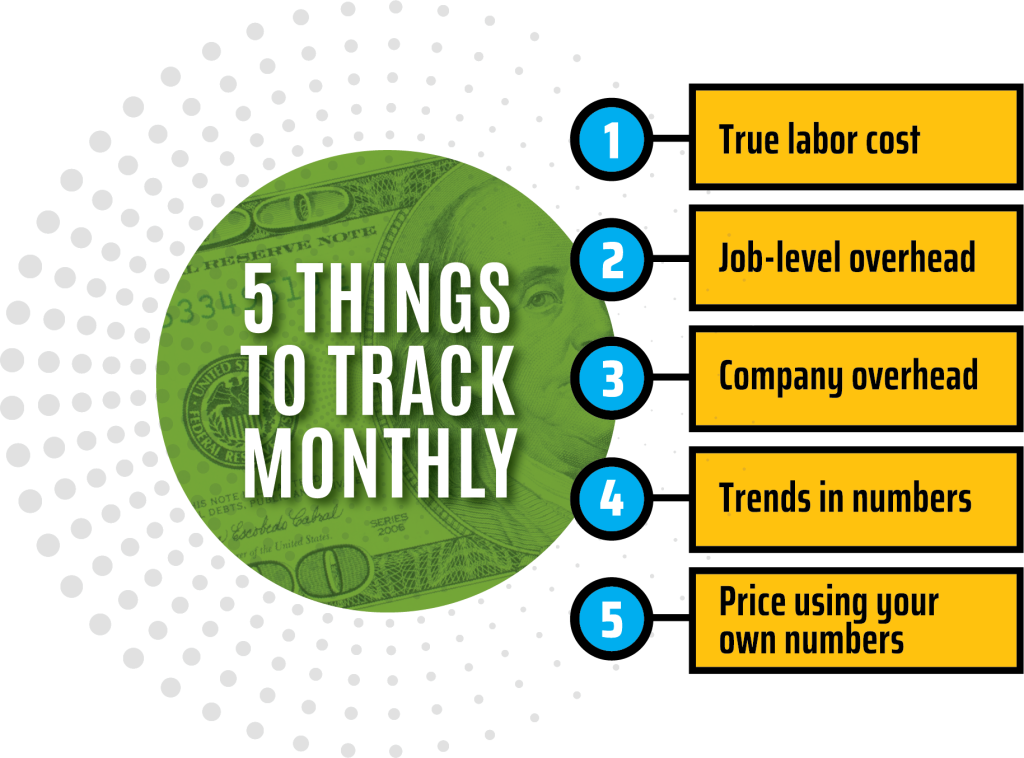
Here’s a simple framework that works across any business model:
- Know your actual labor cost.
- Capture job-level overhead.
- Separate company overhead.
- Review the numbers monthly.
- Price using your own numbers.
Some parts of this business will always carry more substantial margins – equipment, specialty materials, niche services. Others will be thinner. There’s no single “right” overhead number, but there is a right mindset: understand it, own it, and manage it deliberately.
A Better Path Forward
The restoration industry isn’t struggling because anyone failed at their job. It’s struggling because the systems that connect contractors, carriers, and policyholders haven’t kept pace with rising costs, longer timelines, and increasing documentation requirements. And as those pressures have increased, trust has diminished on all sides.
The solution is better alignment on timing, transparency, and the shared goal of closing claims fairly and efficiently.
Here are six practical steps the industry can rally around:
- Timestamped pricing – Use the price list for the month work begins. This keeps pricing current and prevents margin loss caused by delays.
- Faster, documented draws – Tie draws to clear milestones and documentation. When both sides know exactly what’s needed, payments move faster without sacrificing audit quality.
- Scope alignment up front – A short, pre-scope huddle between the project manager and adjuster can confirm method and expected documentation (and save both sides hours of negotiation later).
- Respect local market conditions – Labor, taxes, and compliance costs vary widely. Price to the actual market, not a national myth.
- Clear policyholder communication – Provide a simple “claim roadmap” that sets expectations up front about what’s covered, what’s not, and what the payment schedule is.
- Stop the blame loop – Contractors aren’t overcharging when they show documented costs, and carriers aren’t wrong for asking for clarity. Transparency rebuilds trust, and trust speeds everything up.
Taking Back Profitability
If your company is still profitable in 2025, it’s not luck – it’s discipline. You know your numbers, you document well, you choose the right jobs, and you tell the truth about what the work costs and what it takes to do the job right.
The contractors who will thrive next aren’t just good at mitigation or repair. They manage cash flow, invest in training, build strong documentation habits, and make decisions with long-term stability in mind.
We’re not going back to 2015. The old assumptions and pricing models aren’t coming back either. But this all brings an opportunity to build a more sustainable, transparent way of doing business: one where contractors earn a fair margin, carriers get clean documentation, and property owners get back on their feet faster.
Moving forward, we can build something based on honest math, honest timelines, and honest expectations – this is the kind of industry policyholders deserve.
References
- Restoration Industry Association, 2024 RIA Cost of Doing Business Report (Final Version).
https://2815486.fs1.hubspotusercontent-na1.net/hubfs/2815486/2024%20RIA%20Cost%20of%20Doing%20Business%20Report%20(FINAL%20VERSION).pdf?_hsmi=323778744 - RSMeans, 2025 Contractor’s Pricing Guide: Residential Repair & Remodeling Costs.
https://www.rsmeans.com/products/books/2025-cost-data-books/2025-contractor-pricing-guide-residential-repair-remodeling-costs-book - U.S. Small Business Administration, How to Calculate the True Cost of an Employee.
https://www.sba.gov/business-guide/manage-your-business/pay-employees - Verisk, Property Estimating Solutions Quarterly Report, Q4 2025.
https://www.verisk.com/49d0da/siteassets/media/downloads/property-estimating/pes-q2-property-report.pdf - Verisk, 360Value Quarterly Reconstruction Cost Analysis, Q4 2025.
https://www.verisk.com/siteassets/media/downloads/property-estimating/360value-quarterly-reconstruction-cost-analysis-q4-2025.pdf - LexisNexis Risk Solutions, 2025 U.S. Home Insurance Trends Report.
https://risk.lexisnexis.com/products/home-insurance-trends-report - Insurance Journal, Natural Disaster Claims in 2025 to Again Top $100B Despite Fewer Events
https://www.insurancejournal.com/news/international/2025/10/16/843935.htm - C&R Magazine, “The Quiet Crisis Undermining Property Claims.”
https://www.candrmagazine.com/the-quiet-crisis-undermining-property-claims/ - Property Insurance Coverage Law Blog, Restoration Contractors Need to Charge a Lot More Than 10 and 10, July 2021.
https://www.propertyinsurancecoveragelaw.com/2021/07/articles/insurance/restoration-contractors-need-to-charge-a-lot-more-than-10-10-for-overhead-and-profit-if-they-want-to-stay-in-business/ - United Policyholders, What’s UP with Overhead and Profit?
https://www.uphelp.org/claim-guidance-publications/whats-up-with-overhead-and-profit/ - U.S. Bureau of Labor Statistics, Construction Wage Trends 2010–2025.
https://www.bls.gov/oes/current/oes_nat.htm - National Association of Home Builders, Material Cost Volatility 2023–2025.
https://www.nahb.org/news-and-economics/housing-economics - Moody’s, 2025 North Atlantic Hurricane Season Halftime Recap.
https://www.moodys.com/web/en/us/insights/insurance/2025_north_atlantic_hurricane_season_halftime_recap.html - Risk & Insurance Magazine, Property Claims Management Faces Major Disruptions in 2025.
https://riskandinsurance.com/property-claims-management-faces-major-disruptions-in-2025/ - American Roof Supplements, Understanding Overhead and Profit.
https://www.americanroofsupplements.com/understanding-overhead-and-profit/
Jeff Moore, CR, WLS, CMP, Triple Master (IICRC)

Jeff Moore is a second-generation restorer and the 2025 President of the Restoration Industry Association (RIA) as well as President of ATI Restoration. He started in the family business as a teenager, organizing the warehouse and working his way through nearly every role – from technician and estimator to executive leadership. Licensed in asbestos at 18, Jeff has managed major loss projects from 9/11 to today and brings hands-on insight into mitigation, construction, and large-loss operations. He lives in Phoenix, Arizona, with his wife, Tavia, and their four children – Tyler, London, Savannah, and Phoenix.
Related Posts